

Latest
-

Did Instagram Change its Marijuana Marketing Policy?
Social media may have just gotten a bit easier for marijuana businesses.
-
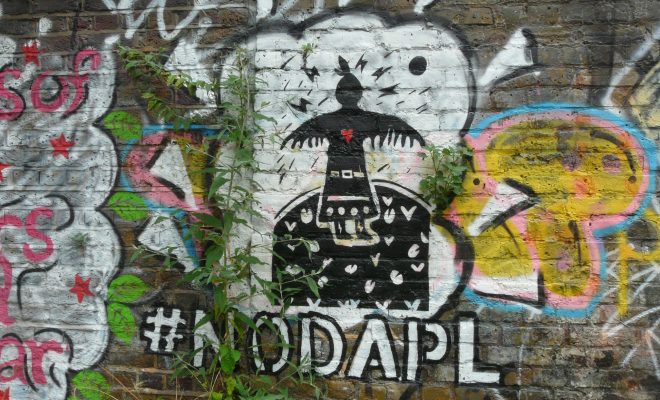
Dakota Access Pipeline Developer Sues Greenpeace, Other Activist Groups
The developer was not happy with those protests.
-
Federal Judge Blocks Texas Voter ID Laws…Again
The judge said the laws discriminate against minorities.
-
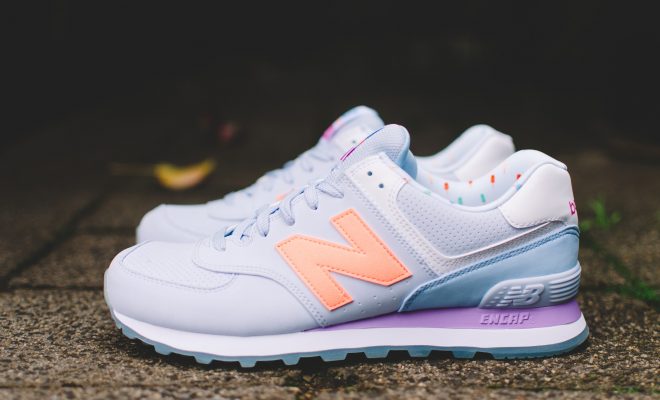
New Balance Wins Huge Trademark Case in China
New Balance kicked some butt in this trademark suit.
-

Top 10 Schools for Entertainment Law
Check out this year's rankings.
-

ICYMI: Best of the Week
Check out Law Street's best of the week!
-
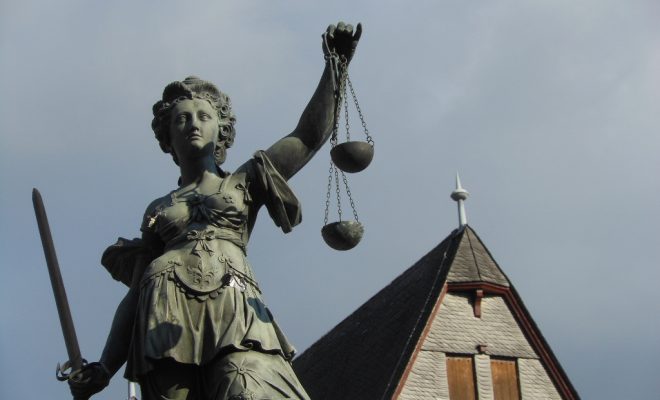
Research Finds Justifiable Homicide Rulings More Likely to Benefit White Americans
Justifiable homicide is one area of the justice system where racial disparities often go unnoticed.
-
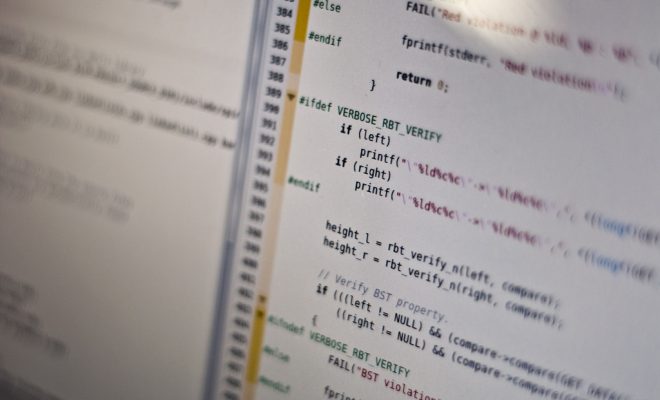
Why are Some Prisons Banning Inmates From Teaching Themselves to Code?
Ohio and Michigan prisons ban books that aim to teach computer programming skills.
-

News Quiz, News Quiz, Get Your News Quiz!
See how you do!
-

Possession of Small Amount of Drugs No Longer a Felony Offense in Oregon
Oregonians may now be charged with a misdemeanor for possessing small quantities of drugs.
-

Comedian Sues the Daily Stormer for Accusing Him of Manchester Terror Attack
He's accusing the white supremacist site of defamation.
-
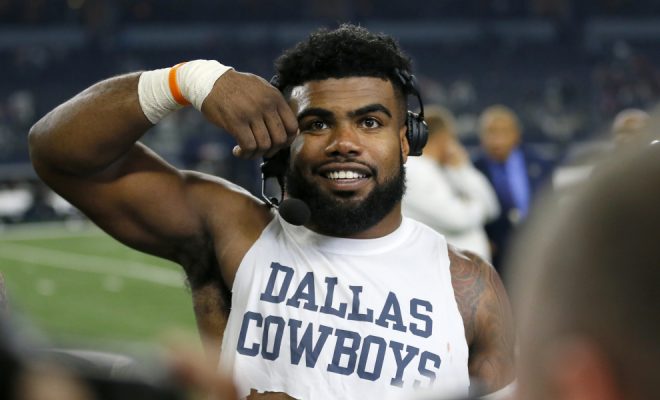
Ezekiel Elliott’s Accuser Admitted to Suggesting Blackmail Over Sex Tapes
The Dallas Cowboys running back is appealing his six-game suspension from the NFL for domestic violence.
-

Tech Companies Dump White Supremacists
It's about time.
-
Charlotte School of Law Closes
Charlotte Law is the second to close this year.
-

RantCrush Top 5: August 17, 2017
RantCrush is a better forward than a racist email.
-

“Before the #Liberals” Meme Trolls Actor With Wacky Monuments
Leave it to the trolls to remind us what's really important...memes!
-

South Carolina Sues OxyContin Maker over Opioid Crisis
The suit claims that Purdue Pharma falsely marketed the drugs as nonaddictive.
-

Marijuana May Not Actually Help with PTSD or Chronic Pain
Two new studies cast doubt on medical marijuana's effectiveness at treating common conditions.
-

What Happens When the First Amendment Is Used to Protect Hate?
How do we combat white supremacist language when hate speech is protected under the First Amendment?
-

RantCrush Top 5: August 16, 2017
A presidential tweet done right...for once.
-

Taylor Swift Vindicated With Groping Lawsuit Win
She won a symbolic victory for women everywhere.
-

Father of Charlottesville Rally Participant Denounces “Hateful” Son
Peter Tefft had been called a Nazi online and on posters in his hometown.
-

RantCrush Top 5: August 15, 2017
GoDaddy says GoAway to the Daily Stormer.
-

Did a Danish Inventor Kill a Female Journalist on His Homemade Submarine?
You have to read this story to believe it.
-

Hawaii’s First Marijuana Dispensary Has Already Run Out of Weed
Is this Nevada all over again?

