 Image courtesy of [Ian Aberle via Flickr]
News
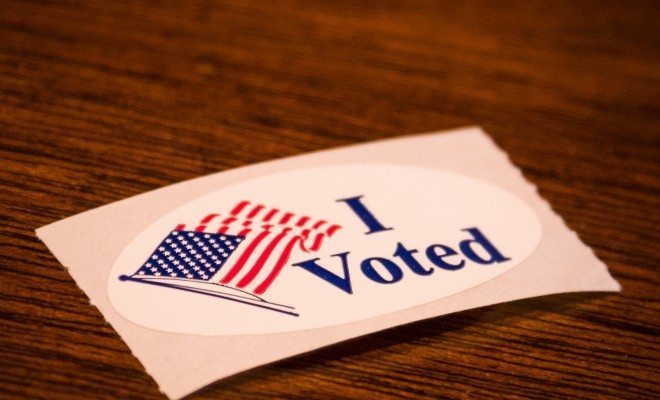
The Votes Are In: 2014 Election Was Most Expensive & Least Representative
It’s official, the 2014 elections were the most expensive midterm elections in history, costing a total of $3.77 billion, or roughly $46 per vote according to voter turnout estimates. Even more surprising is the fact that there were fewer donors in the 2014 midterms than in any election since 1990, according to the Center for Responsive Politics (CRP). This means that not only was this the most expensive midterm election in history, its funding came from fewer people than in years past. Additionally, voter turnout estimates indicate that the percentage of eligible voters who cast ballots in November was the lowest since World War II.
Read more: Campaign Finance: Free Speech or Unfair Influence?
All things considered, the 2014 midterm elections reveal a disturbing trend in American politics, one where a shrinking group of Americans funds elections and voter turnout among the entire population continues to decline.
Spending Breakdown
Candidate and party spending was over $2.7 billion in the 2014 election, according to estimates from the CRP. One possible reason for the increase in the 2014 election was the McCutcheon v. FEC ruling, which struck down the cap for how much an individual can spend in an election cycle while leaving in place limits for individual races and organizations.
An additional $768 million was spent by a variety of independent groups that are not directly affiliated with campaigns.Outside expenditures can come from Super Pacs, 527 organizations, and 501(c) groups that the IRS categorizes as social welfare organizations.
These social welfare organizations are allowed to engage in political activity as long as it is not their primary focus, which in practice means that political spending must account for less than 50 percent of the organization’s budget. In essence, these groups are able to collect unlimited funds from donors, whose names they do not need to disclose, then spend that money on political advertising with a small set of restrictions. For more background information on campaign finance and dark money check out this explainer by Law Street’s Alexandra Stembaugh.
This chart, from the Center for Responsive Politics, details the sources of political spending in the 2014 election by party. For more information on spending in the 2014 election, look at the CRP’s overview.

2014 Election Spending by Category and Party, Source: Center for Responsive Politics
Fewer Donors, More Money
Another one of the Center for Responsive Politics’ major findings about the 2014 election was that the increase in total donations actually came from fewer donors when compared to the 2010 election (the previous midterm). In fact, the number of donors decreased in every category of campaign spending.
According to Russ Choma from the Center for Responsive Politics,
“There were just 434,256 identifiable individual donors to candidates in the 2014 election. That’s 107,000 fewer than there were in the 2010 election.”
CRP identified 773,582 donors in the 2014 election–a decrease of nearly 11 percent relative to the 2010 midterms–yet average contributions rose over 36 percent to $2,639 per donor. It is important to note that these numbers come from FEC data, which does not include donor information for individuals who give less than $200. In terms of outside spending, there were 6.4 percent fewer donors, but the average donation per donor rose nearly 450 percent, going from roughly $1,800 to over $8,000 per donor.
Are liberals catching on to dark money?
Although Republicans/conservatives maintained their significant advantage in dark money spending, accounting for nearly 75 percent of total spending, Democrat/liberal groups did see large increases.

Source: Center for Responsive Politics
The chart above illustrates the recent trends in dark money spending. Conservative groups retained their healthy lead in dark money in the most recent election, going from $119.9 million in 2010 to $124 million in 2014. Dark money spending among liberal groups increased by over 300 percent since 2010, going from $10.7 million to $35.7 million in 2014.
It is important to note that these numbers are limited to what is disclosed to the FEC. Regulations for 501(c) organizations only require disclosure of political spending that occurs 30 days before a primary election or 60 days before a general election. However, the Center for Responsive Politics found that these organizations tend to run “issue” ads outside of these windows to discuss political issues without reporting their spending. As a result, actual political spending likely exceeds the total disclosed to the FEC.
Lower Turnout
Finally, preliminary estimates indicate that only 35.9 percent of eligible voters participated in the 2014 election, the lowest turnout since 1942. This number taken from estimates by the United States Election Project at the University of Florida, which uses voting statistics for the highest office on each state’s ballot to estimate total voters (highest office is used because total vote counts are not available for every state).
These estimates indicate that only six states had a voter turnout greater than 50 percent, while eight states had rates below 30 percent. Although midterm elections historically have lower turnout rates relative to presidential election years, the 2014 election was low even for a midterm. For comparison, voter turnout in 2010 was 41 percent of eligible voters, and the 2012 presidential election had a turnout of 58.2 percent.
The chart below shows voter turnout from 1789 – 2014

Source: United States Election Project
In a time where Americans’ opinions of the government are near record lows, apathy among the general population seems to explain the turnout. Everyone loves to poke fun at headlines that claim Americans are more approving of lice, telemarketers, Genghis Kahn, and even Nickleback than of Congress, but the turnout for the recent election truly reveals the state of political engagement among the public.
While average Americans are less willing to cast a ballot, a small subset of the population is exhibiting more interest in politics than ever before. In a time where people overwhelmingly disapprove of their government and want to limit the role of money in politics, one would think showing up on election day is the next step, but sadly the opposite occurs.


Comments