 "United States" courtesy of [Dave Winer via Flickr]
Crime
How Have Murder Rates Changed in America’s Largest Cities? Here’s a Map
When the FBI released the latest round of national crime statistics, most attention was quickly drawn to the significant rise in the number of murders. Statistics for the 2015 calendar year, released by the FBI on Monday, show that there was an estimated 10.8 percent increase in the number of murders in the United States.
Click here to read more Crime in America coverage.
That jump, as well as the current number of murders in the United States, can be interpreted in many different ways. First, an increase of more than 10 percent is the largest spike in recent history and marks an alarming change almost any way you look at it. What’s particularly troubling is that we don’t yet have a great explanation to account for why this happened.
But the other way to look at it–comparing the murder rate in 2015 to that of previous years–paints a different picture. Despite that dramatic jump, the U.S. murder rate remains near historic lows. In fact, we had fewer murders last year than we did in 2008 and last year’s murder rate, which is adjusted for population, was lower than the one in 2009 despite going up 10 percent. While the jump from 2014 to 2015 was quite large, 2014 had the lowest murder rate in over two decades.
Put simply, you can use the most recent numbers to bolster two very different arguments about crime in America. One approach that might be more helpful is to look at the way in which murder rates change between cities. In fact, change in the murder rates varied widely in America’s largest cities.
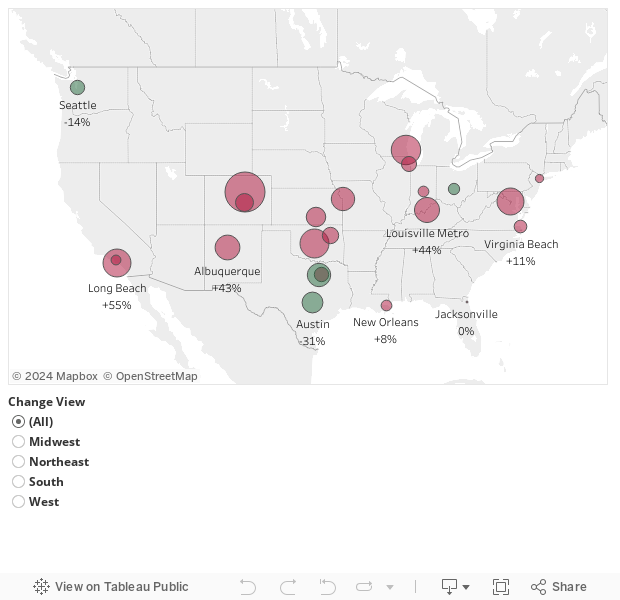
The map below details how murder rates changed in the 50 largest cities with two consecutive years of murder statistics available from the FBI. While this does not include each and every one of America’s largest cities, given that not every city’s data is reported by the FBI, it includes almost all of them. The green and red bubbles indicate positive and negative changes, respectively, and the size of the bubble indicates the size of the change. Note that the map shows the percent change in the murder rate from 2014 to 2015, not the actual rate for each city.
Scroll over each city for additional details and change the view by zooming or selecting a region in the filter below the map. To reset the map hit the home button on the top left panel.


Comments