
Crime in America Interactive Statistics: Trends in America’s Largest Cities
Each year, typically sometime in the fall, the FBI releases its annual crime statistics telling us how crime changed last year. While that snapshot is certainly helpful when trying to understand the state of crime in America, it’s often more informative to look at trends over time. For example, hearing that the total U.S. murder rate went up by more than 11 percent in 2015 may sound particularly shocking, but it’s also important to know that rate remains near multi-decade lows.
Jump to the dashboard
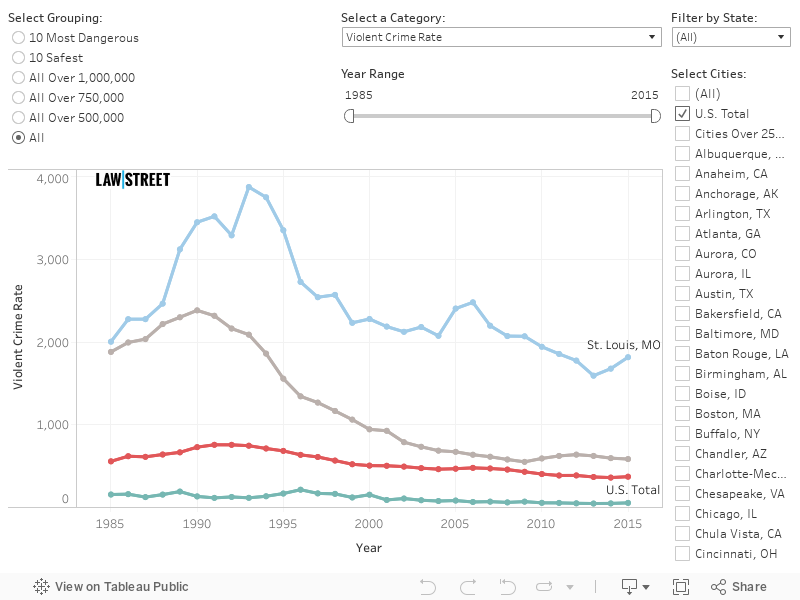
With each release of FBI data, Law Street ranks the Top 10 Safest Cities Over 200,000, the Top 10 Most Dangerous Cities Over 200,000, and the Top 10 Most Dangerous Cities Below 200,000. The rankings use FBI data–the most authoritative source for crime statistics–to provide a unique look at crime in major U.S. cities. The dashboard below expands on that coverage to illustrate exactly how crime has changed in a way that is often difficult to visualize. With it, you can see historical data going back to 1984 for every city with available data and a population greater than 200,000 in the 2015 calendar year.
Claims about crime rates abounded during the 2016 presidential election and continue to be made in several important public forums. Given the recent rise in attention to fake news, it’s important to have tools to help separate facts from fiction. How does the current violent crime rate compare to what it was 10 years ago? How many years in a row has the murder rate increased in St. Louis–the most dangerous city with a population over 200,000? Those questions and questions that will continue to emerge can be answered with this dashboard.
Read more of Law Street’s Crime in America coverage
How to Use the Dashboard
- Select a group: Compare cities on Law Street’s list of Top 10 Safest or Most Dangerous as well as cities that fit various size thresholds based on the most recent data.
- Select cities to compare within that group. You can also see how cities compare to two benchmarks calculated by the FBI: the national rate and the rate for all cities with populations greater than 250,000. Depending on the selected grouping the dashboard will show the U.S. total as well as the most dangerous city, the safest city, and/or the largest city by default.
- Pick a category: The data is broken down into cities’ overall violent crime rate, and the rate for each of the four component categories–murder, rape, robbery, and aggravated assault.
- Hover over a line for details on the corresponding city and select a point to highlight that city’s line.
- Note: The FBI began implementing a revised definition of rape in 2013; rape rates for the two definitions are not directly comparable. For more information click here.
Source: FBI Uniform Crime Report; accessed through the UCR data tool and the FBI’s annual “Crime in the United States” publications.
Explanatory Notes:
Rape Definition Change: In 2013 the FBI changed the definition of rape to be more inclusive and accurate. Individual cities began to change their reporting procedures to comply with the new definition starting that year. At some point between 2013 and 2015, most of the cities on this dashboard began using the revised definition. Select a point to see whether a city used the revised or legacy definition in a given year. Statistics collected under one definition are not directly comparable to data collected using the other. For more details on exactly what was changed click here.
Footnotes:
Below are explanatory notes that correspond to each footnote on the dashboard. Cities with footnotes have a number in parentheses next to their name when selected. For more details on a specific footnote, select the corresponding point on the chart above.
1) Because of changes in the state/local agency’s reporting practices, annexations, and/or incomplete data, figures are not comparable to previous years’ data.
Footnote one applies only to the following cities for the years indicated: Albuquerque, New Mexico–1995, 1996; Atlanta, Georgia–2014; Austin, Texas– 1995, 1997, 2000; Bakersfield, California–2003; Baton Rouge, Louisiana– 1996, 2002; Chandler, Arizona–2012; Cincinnati, Ohio–1999, 2000; Columbus, Georgia–2014; Columbus, Ohio– 2004; Denver, Colorado–2005; Des Moines, Iowa–2005, 2006, 2009; Detroit, Michigan–1993, 2003, 2004, 2005; Durham, North Carolina–2006; El Paso, Texas–2005, 2006; Fort Wayne, Indiana– 2006, 2010; Fresno, California–2005; Garland, Texas–1993; Houston, Texas–1993; Indianapolis, Indiana–1994, 1996, 1997, 1998, 2002, 2014; Jersey City, New Jersey–2015; Kansas City, Missouri–2006, 2010; Las Vegas, Nevada–2002; Lexington-Fayette, Kentucky–2001, 2006, 2012; Los Angeles, California–2005; Madison, Wisconsin–2000, 2010; Memphis, Tennessee–2001; Mesa, Arizona–2002; Milwaukee, Wisconsin–2005; Modesto, California–2002; Moreno Valley, California–2003; New Orleans, Louisiana–2000; Oakland, California– 1991; Omaha, Nebraska–2000; Philadelphia, Pennsylvania–1999; Pittsburgh, Pennsylvania–1991; Reno, Nevada–2001, 2002; San Antonio, Texas–1999; San Jose, California–1997; Tacoma, Washington–2007; Toledo, Ohio–2001, 2002; Anaheim, California–1993; Buffalo, New York–2012; Glendale, California–2001; Rochester, New York–2012; Yonkers, New York 2012; Mobile, Alabama–1986, 1995; New York City, New York–2012; Savannah, Georgia–2014; Louisville, Kentucky–2005
2) The 168 murders that occurred as a result of the bombing of the Alfred P. Murrah Federal Building in Oklahoma City in 1995 are included in the national estimate; however, the 2,823 murders that occurred as a result of the events of September 11, 2001, are not included.
3) Cities with this footnote began that year submitting rape data classified according to the legacy UCR definition, however, at some point during that year, these cities modified their reporting methods and began classifying and submitting rape offenses according to the revised UCR definition of rape.
Footnote three applies only to the following cities for the years indicated: Irvine, California–2015; Riverside, California–2014; Santa Ana, California–2015, Anaheim, California–2015; Buffalo, New York–2014; Glendale, California–2015; Rochester, New York–2014; Yonkers, New York–2014; New York City, New York–2014; Louisville, Kentucky–2014.
4) For all Illinois agencies between 1985 and 2009, the data collection methodology for the offense of rape used by the State Uniform Crime Reporting (UCR) Program did not comply with national UCR Program guidelines. Consequently, their figures for rape and violent crime (of which rape is a part) are not included.
Footnote four applies to Aurora, Illinois, and Chicago, Illinois.
5) The Charlotte Police Department and the Mecklenburg County Police Department merged into one department in 1994.
6) Rape statistics for Chicago are not available between 1985 and 2013, as a result, data violent crime (of which rape is a part) is also not available. Between 1984 and 2009 the Illinois UCR program did report rape statistics in compliance with the FBI’s guidelines (see footnote 4). Between 2010 and 2012, the city of Chicago still did not report rape in compliance with the FBI’s definition. In 2013, the FBI determined that the Chicago Police Department underreported the number of rape offenses so the data was excluded from the FBI’s report.
7) From 1998 through 2015, the population for the city of Mobile, Alabama includes inhabitants from the jurisdiction of the Mobile County Sheriff’s Department.
8) Crime statistics for Louisville and Jefferson County police departments were combined after the formation of the Louisville Metro Police Department in 2002.
9) Crime statistics for the Savannah and Chatham police departments were combined after the formation of the Savannah-Chatham Metropolitan Police Department in 2005.
Featured image: “Police revolving light” courtesy of reynermedia; License: (CC BY 2.0)